EDITOR’S NOTE: All statistics discussed herein are based on the best currently available data received from KCAD on April 23, 2019. We know there are some gaps in this data and some potential for errors, but this analysis incorporates the data as we received it this week and represents the best data currently available. If we receive different information, we will update this article immediately.
Last year the City of Kerrville implemented a program called the TIRZ, which stands for Tax Increment Reinvestment Zone. Under this program, “incremental” tax revenues are reinvested within the geographic zone that the city defined, which includes all of the downtown area. See our previously published video below to refresh yourself on what the TIRZ is and how it works.
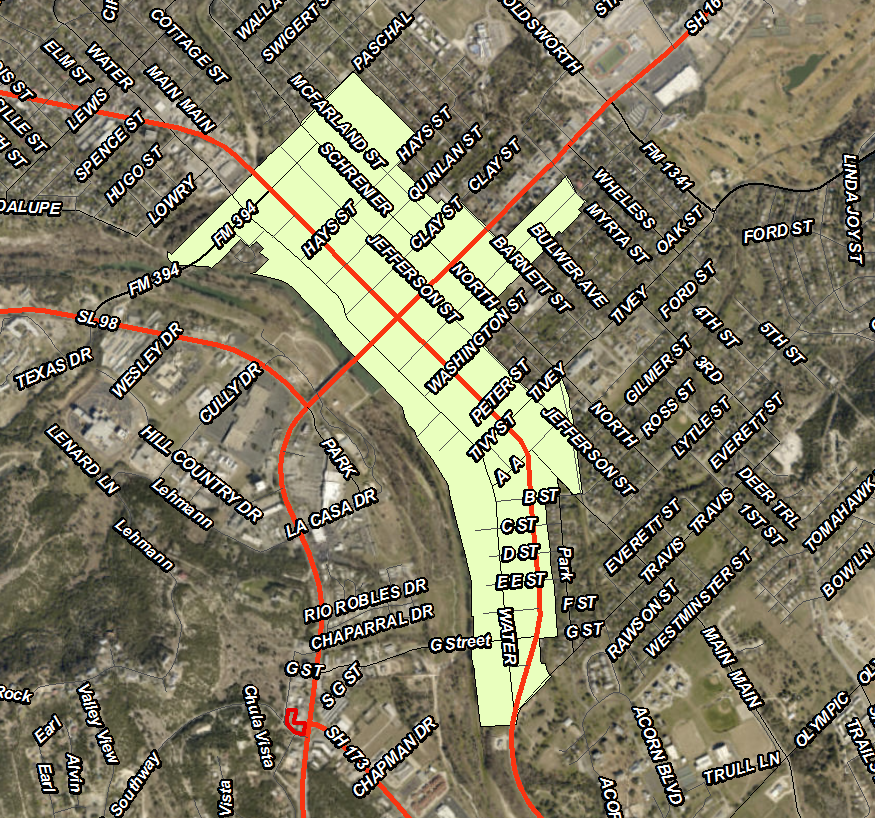
Here is a map of the TIRZ area. A more detailed map is available here.
Does the TIRZ have anything to do with the rise in property valuations by KCAD?
There have been some theories posited online that suggest that the implementation of the TIRZ is somehow responsible for the rise in property values within that geographic zone. We heard from folks that identified specific examples of sharp rises in property values within the TIRZ. But these random examples don’t tell us much if we don’t have a full picture of the data. So, we went to KCAD, got the full data set for the entire county’s valuations going back to 2015, and we started crunching numbers.
Using GIS software, we identified all of the parcels within the TIRZ. There are approximately 600 parcels* in this geographic zone. Here are some takeaways for the TIRZ specifically:
- The total market value within the TIRZ in 2019 is $133 million.
- The total market value within the TIRZ in 2018 was $123.4 million (Please note that this value differs from the one the city presented in 2018 when discussing the TIRZ. We have reached out to the consultant to see why our numbers differ.)
- That is an increase of approximately $9.63 million, or approximately 7.8%.
- Compare that with the county-wide increase in total market value of approximately 7.3%.
- The total value within the TIRZ rose just slightly more sharply than the county as a whole.
- Given that the TIRZ makes up a significant portion of downtown commercial property, a slightly sharper rise is not unexpected.
(* Footnote: Parcels come and go year to year, so the number of parcels isn’t actually consistent from year to year. There are several reasons for this, but those reasons are outside the scope of this article.)
Now let’s go over some of the specific changes within the TIRZ:
- There are approximately 589 parcels within the TIRZ that have appraisal values for 2019.
- Of those, 165 parcels (28%) increased in value from 2018 to 2019.
- Of those that increased, the average increase was approximately $81,000.
- 395 TIRZ parcels (67%) saw no change in value from 2018.
- 29 TIRZ parcels (5%) were decreased in value from 2018.
Here is a map showing the TIRZ parcels. Gray had no change, green decreased in value, and orange increased in value.

What about the City of Kerrville as a whole?
Here are a few statistics about the city valuations as a whole (inclusive of the TIRZ area):
- There are approximately 11,000 parcels within the City Limits (as per the KCAD assignment of CKV taxing entity)
- The 2019 total market value for CKV parcels is $2,239,352,154
- The 2018 total market value for CKV parcels was $2,041,671,250
- The one-year increase was approximately $198 million (9.7%)
- Compare this figure with the county-wide increase of approximately 7.3%.
- 314 city parcels decreased in value since last year (2.8%)
- 3,867 city parcels did not change since last year (35%)
- 6,810 city parcels increased in value since last year (62%)
Notably, property within the TIRZ decreased LESS sharply than the city as a whole. The TIRZ increased approximately 7.8% while the city as a whole increased approximately 9.7%.
Also, the percentage of properties within that TIRZ that saw an increase is lower than the percentage of properties citywide that saw an increase.
Takeaways
While valuations of properties within the TIRZ did rise sharply from 2018-2019, they actually increased less sharply than the city as a whole. Properties within the TIRZ were LESS LIKELY to see an increase than properties in the city as a whole.
Again, we are studying this with the best available data. KCAD and the various taxing entities will receive certified copies of appraisals in the coming weeks, so the exact values may change. We will update our website with new information as it becomes available.


