
As Kerr County voters prepare to go to the polls on Tuesday, what kind of turnout numbers can we expect in this election? Who votes? How old are they? Where do they live? Although we can’t predict the future, we can look back at the 2016 turnout data to draw some interesting conclusions about the voters in each party.
Early voting begins on Tuesday across the state of Texas and in Kerr County, of course, at two locations in our county: Cailloux Theater in Kerrville and West Kerr County Annex in Ingram.
Almost 14,000 voters participated in the 2016 primary elections (including D’s and R’s) out of about 35,000 registered voters (a turnout of roughly 40%). Here are some of the other takeaways from the 2016 Primary Election.
Republican Primary

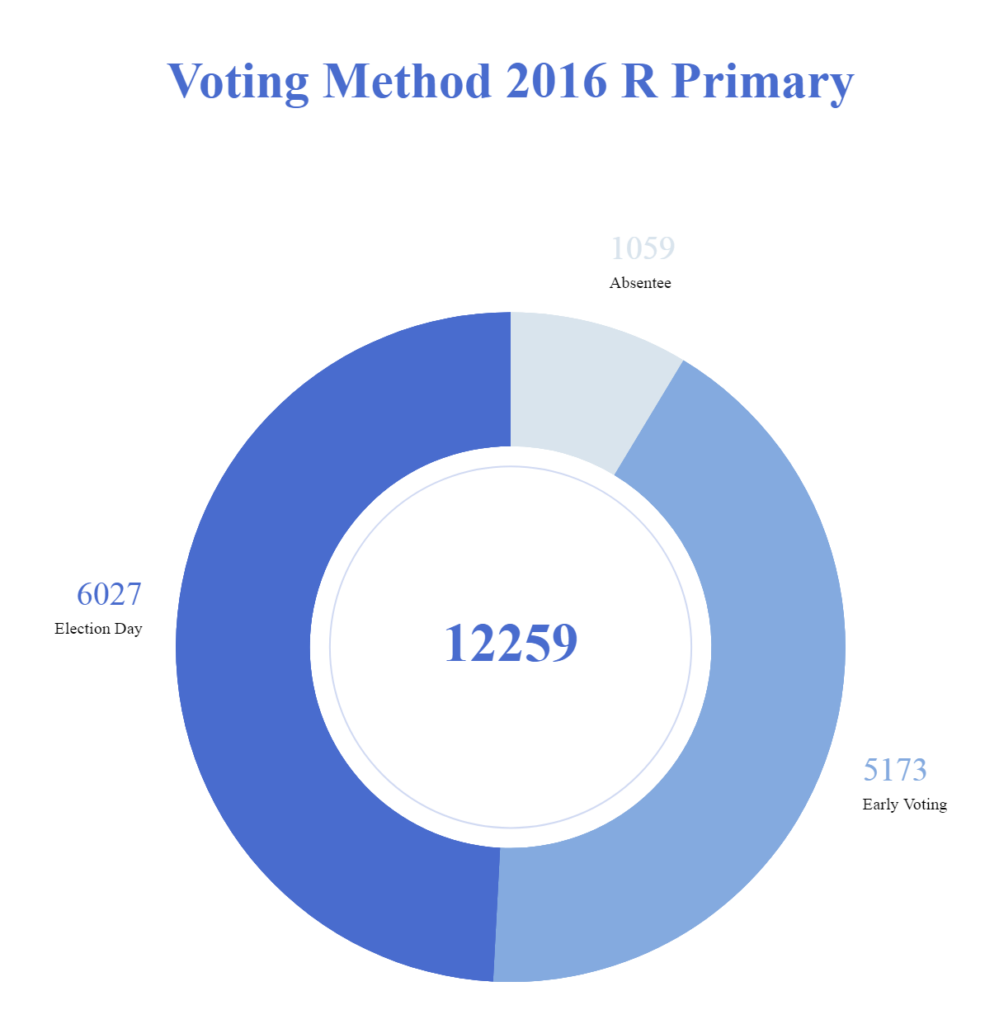
The vast majority of voters in our county cast a ballot in the Republican Party Primary. In 2016, there were approximately 12,259 ballots cast in that party’s primary election. A plurality of voters cast their ballot on election day, but a majority of voters either chose to vote early or by absentee ballot. See the chart below.
Turnout by Precinct
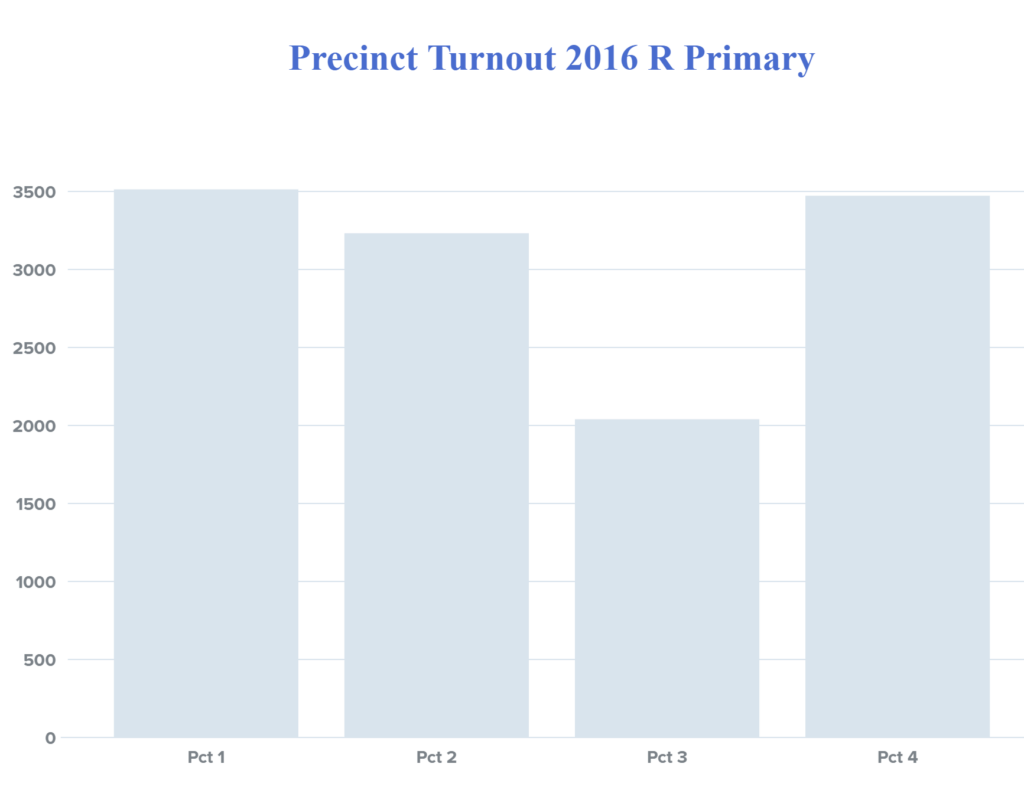
The ballots cast by precinct are not equal. As you can see in the chart below, the largest number of ballots were cast in Precinct 1, followed by Precincts 4 and 2. But Precinct 3 lagged far behind, with just over 2,000 ballots cast.
Voter Age
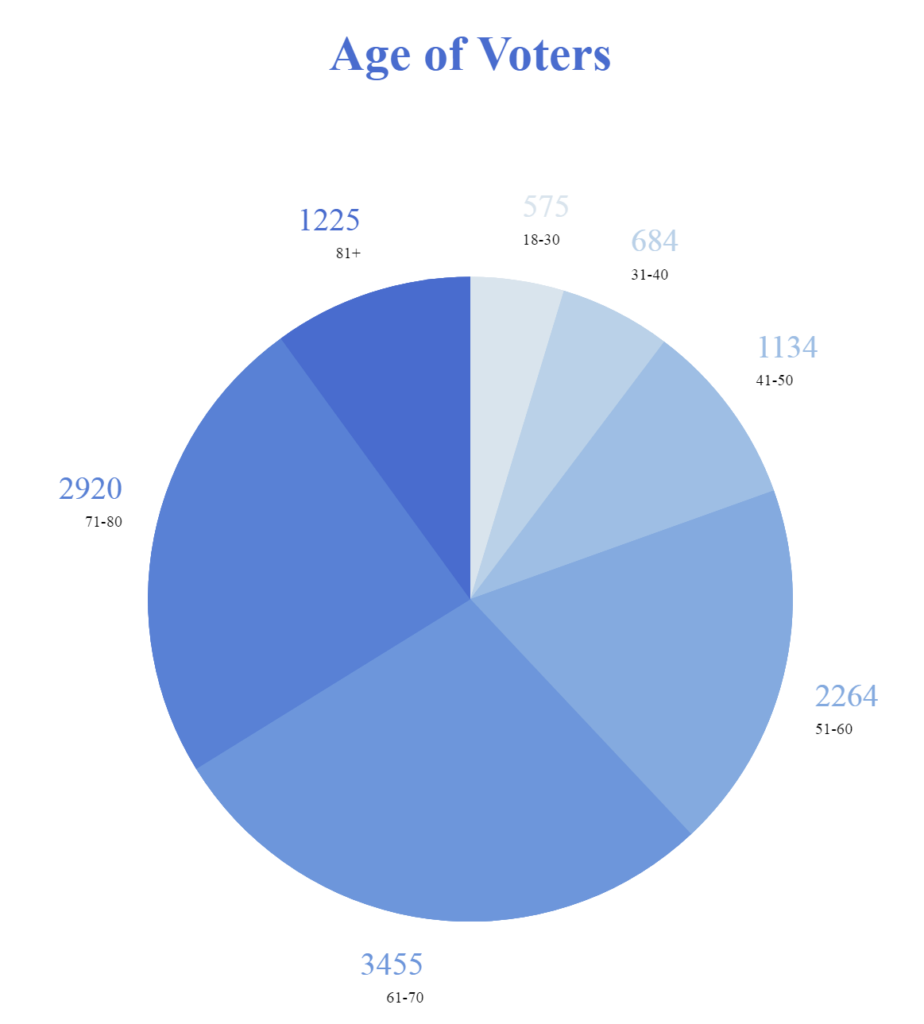
In 2016, the average Republican primary voter was 63 years old. About two-thirds of voters were age 60 or above. The largest age group was voters between the age of 61 and 70 years.
Another way of looking at the age of voters is with a histogram. As you can see by looking at the chart below, the voting power of older residents is much higher than the voting power of younger residents.
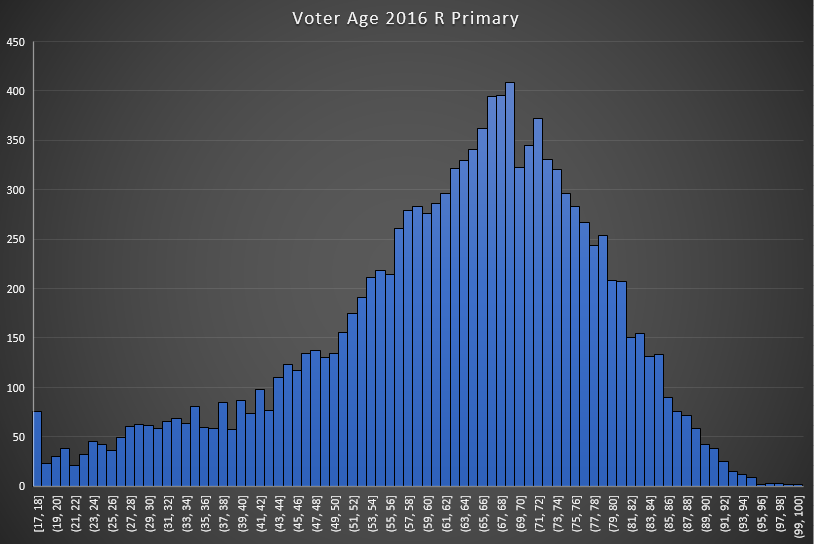
The takeaway here is that 50-80 year old voters dominate the Republican elections in Kerr County. This may seem intuitive, but the actual distribution of registered voters is not so skewed. The histogram chart below shows the age distribution of registered voters in 2020.
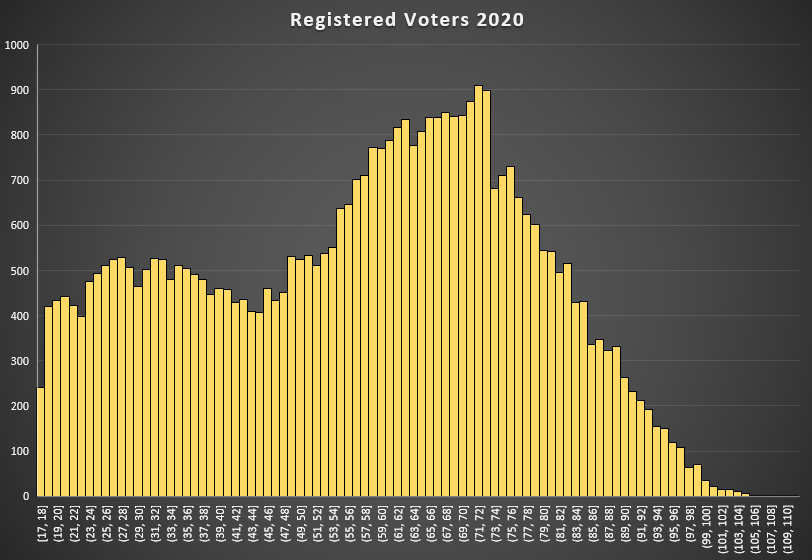
If every registered voter actually cast a ballot, it would take every single voter aged 60 and under to achieve a majority. That is, there are equal numbers of registered voters under 60 as there are over 60 in Kerr County.
Other Demographics
Republican voters self-reported as 51% female and 45% male (the remaining 4% chose not to report this information). Just 5% of Republican voters self-reported as being of Hispanic descent. And 58% of Republican voters did not reside within the city limits of Ingram or Kerrville (rural voters).
Democratic Primary

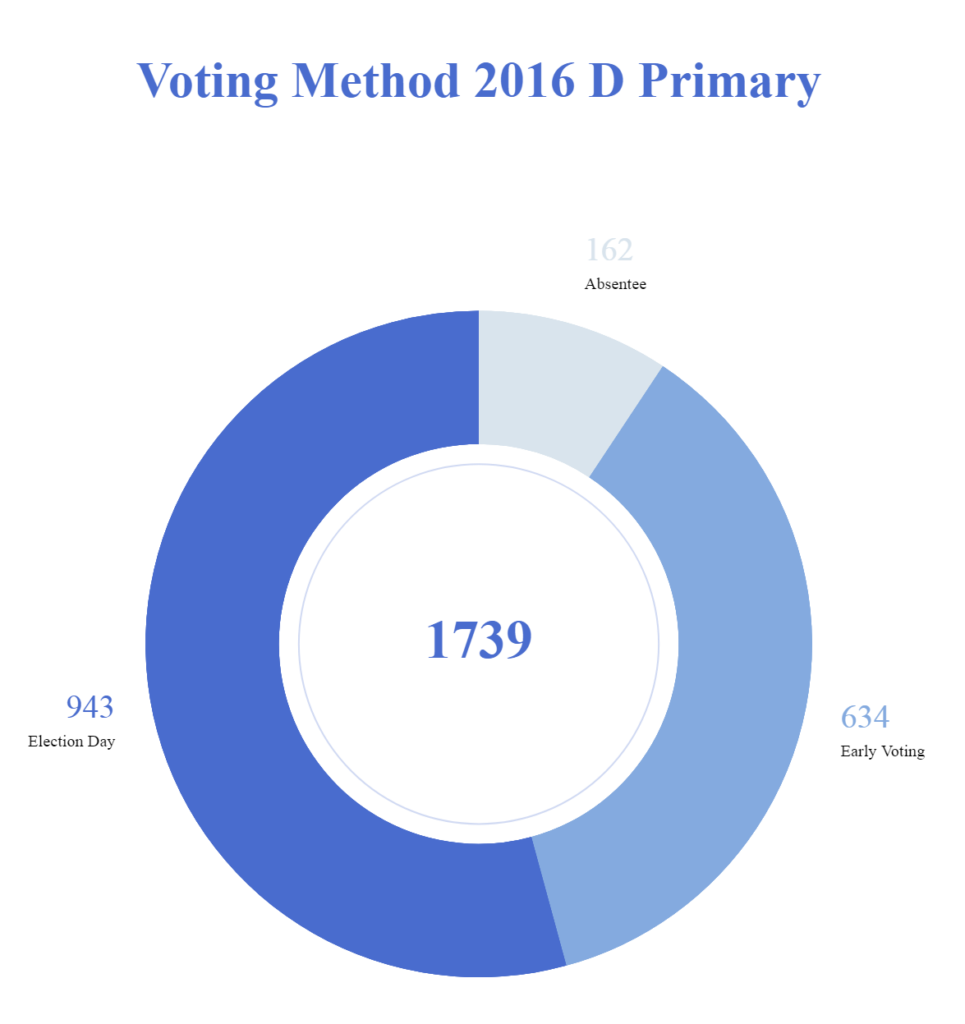
There is a much smaller number of Democratic Party voters for primary elections in Kerr County. In 2016, approximately 1,739 Democrats cast a ballot — about one-seventh of the Republican turnout. This doesn’t necessarily mean that there are only 1,739 Democrats in Kerr County, though. Many Democrats vote in the Republican primary because so many races have no Democratic challenger. So the only opportunity many Democrats have to make their voice heard in local races is to vote in the Republican primary. Several local races are examples of that in 2020, including Tax Assessor/Collector, and Constable Precinct 4, and for all intents and purposes, the Sheriff race, too.
A similar percentage of Democratic voters choose to vote via absentee ballot, but a much higher percentage of Democrats vote on election day. In 2016, approximately 54% of Democrats voted on election day (compared with just 49% of Republicans).
Turnout by Precinct
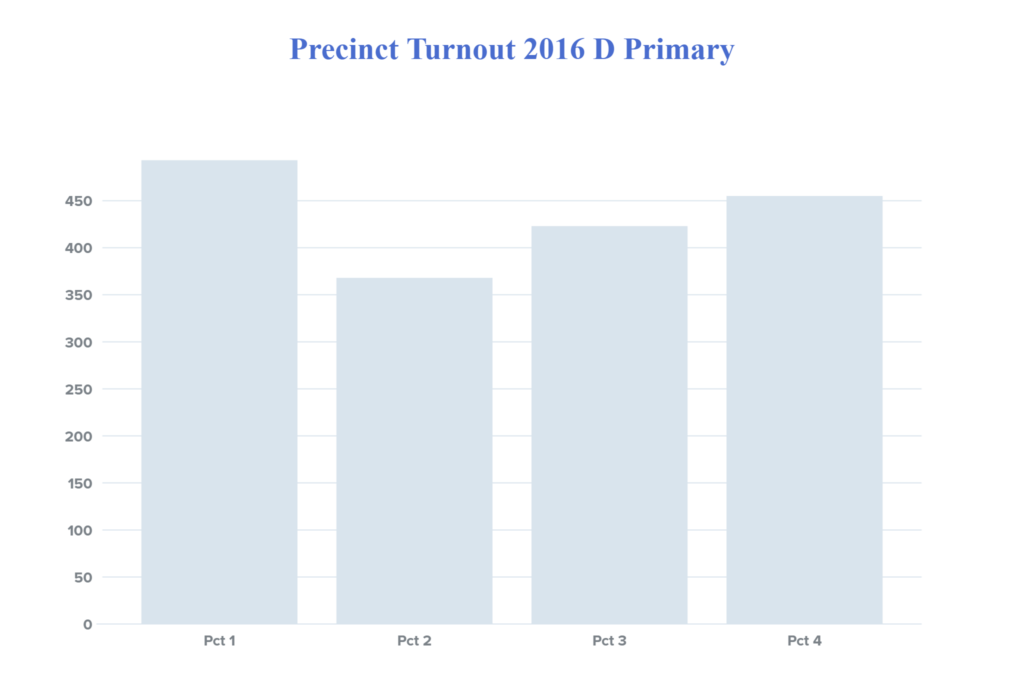
The highest number of Democratic ballots in 2016 originated from voters in Precinct 1 (this precinct also had the highest number of Republican ballots). The lowest number of Democratic ballots came from Precinct 2.
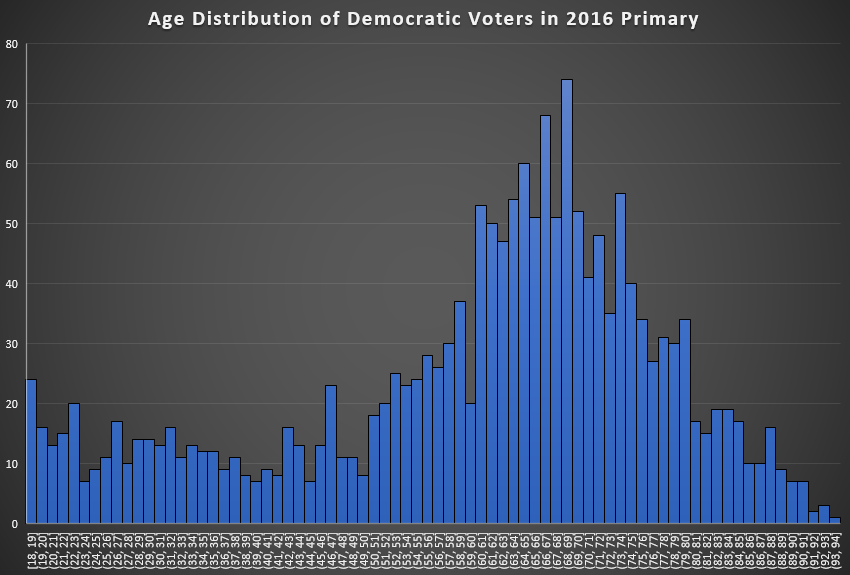
Age of Voters
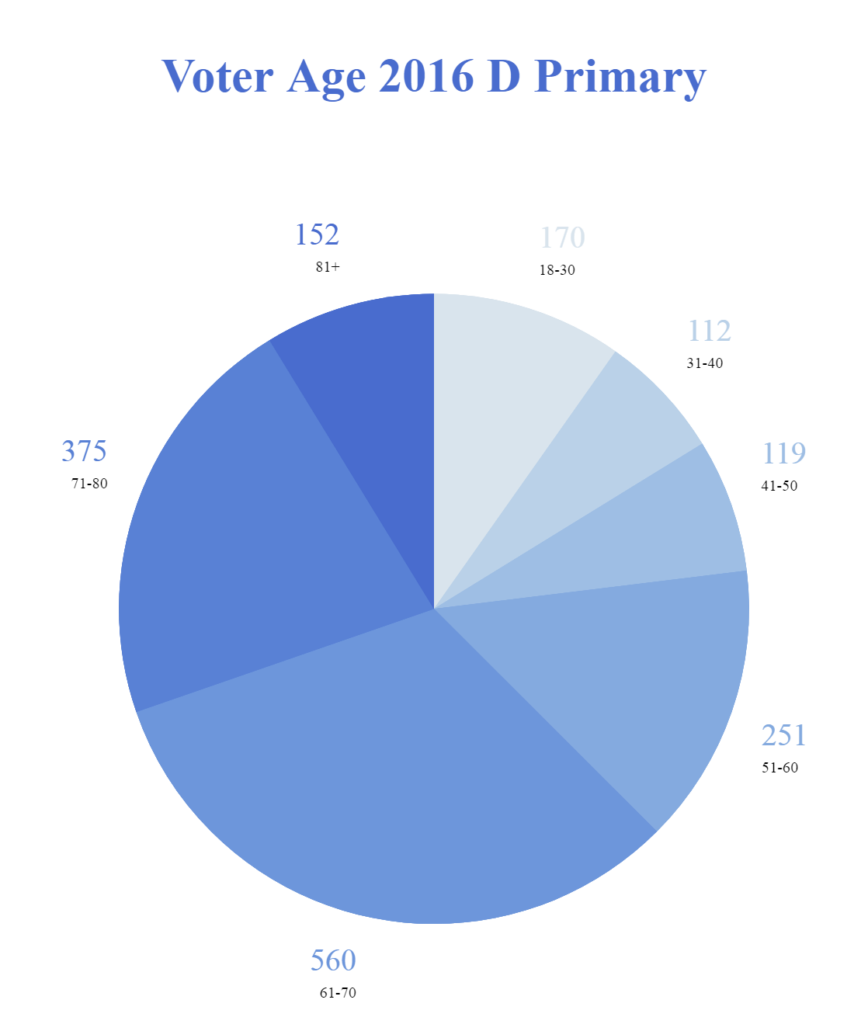
The average age of a Democratic primary voter in 2016 was 61. This means that Democrats, on average, are slightly younger than Republicans in Kerr County (their party’s average was 63 years of age). About two-thirds of all Democratic voters are aged 60 and above.
Again, the registered voter distribution for comparison.
Other Demographics
Democratic voters self-reported as 59% female and 37% male (the remaining 4% chose not to report this information). Approximately 14% of Democratic voters self-reported as being of Hispanic descent. And a majority — 51% of Democratic voters reside within the city limits of Ingram or Kerrville (urban voters).
Takeaways
- There are equal numbers of registered voters below age 60 versus above age 60 in Kerr County. However, older voters consistently vote in greater numbers than younger voters.
- In both 2016 party primaries, about two-thirds of the voters were over age 60.
- An equal portion of Democrats and Republicans prefer absentee voting, but a larger percentage of Democrats prefer to vote on election day instead of voting early.
- Democrats self-reported higher percentages of female voters (59%) compared to Republican voters (51%) but both parties’ votes were majority female.
- Approximately 14% of Democrats said they came from Hispanic descent, while only 5% of Republicans claimed Hispanic heritage.
- A strong majority of Republican voters reside outside of a city’s municipal limits (58%) while a majority of Democrats (51%) are urban voters, residing within the city limits of Ingram or Kerrville.
References
We relied on voter registration and voter rolls data provided by the Kerr County Elections office from 2016 to the present. This information is not available online, but is a public record available at the courthouse.


