
Now that we’ve had a few days to digest the results of the 2019 election, we can start identifying trends and drawing conclusions about how well our community came out to vote for this year’s city council races. All of the data used herein is drawn from publicly available sources.
Here are some of the things we wanted to know…
- What was the turnout figure?
- What age groups are voting?
- How many first-time voters did we have this year?
Let’s examine each of these topics one at a time.
Turnout
As we mentioned in our previous article about this election, the overall voter turnout in this election was approximately 19.6% of registered voters. The quantity of ballots cast in this election is the third-largest in Kerrville history, and this turnout number is triple the low point of 2013. We have seen a steady increase in turnout since 2013.

Age
One of the misunderstandings about Kerrville’s population is that it’s not overwhelmingly skewed towards the older folks among us. In fact, only about 30% of the population is over the age of 62. And for our purposes in this article, about 38.6% of the population is over the age of 55. Those from 18 to 54 years of age make up about 38.8%. So as we compare voter numbers, keep in mind that the 18-55 population is nearly numerically identical to the over 55 population. (US Census Factfinder)
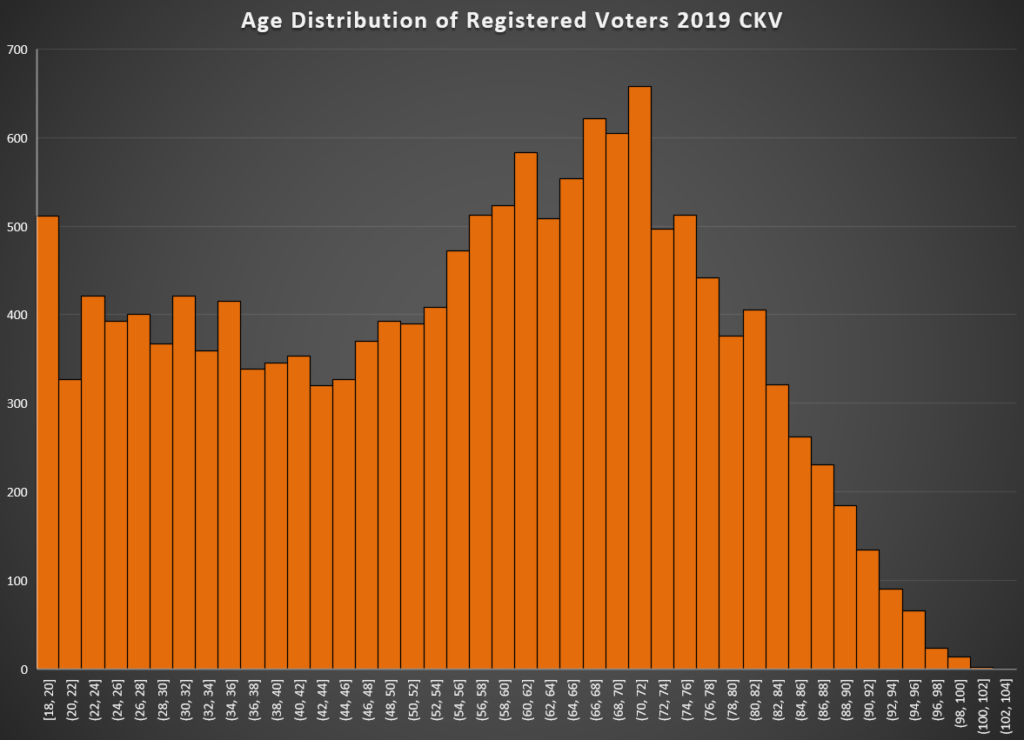
But as we look at registered voters, we can see that the majority of voters are, in fact, over 55. There were 15,455 registered voters in April 2019, and of those, 56% were over the age of 55. Only 44% were under 55. So we can already see a disparity between the age distribution of Kerrville’s overall population versus the age distribution of registered voters.
But wait, there’s more. When we look at the number of folks who actually voted in 2019, we find that 79% of voters were over the age of 55. Only 21% of voters were under the age of 55. So we see a large disparity between not only the general population versus the registered ages, but we also see that the vote is heavily shifted to the older end of the spectrum.
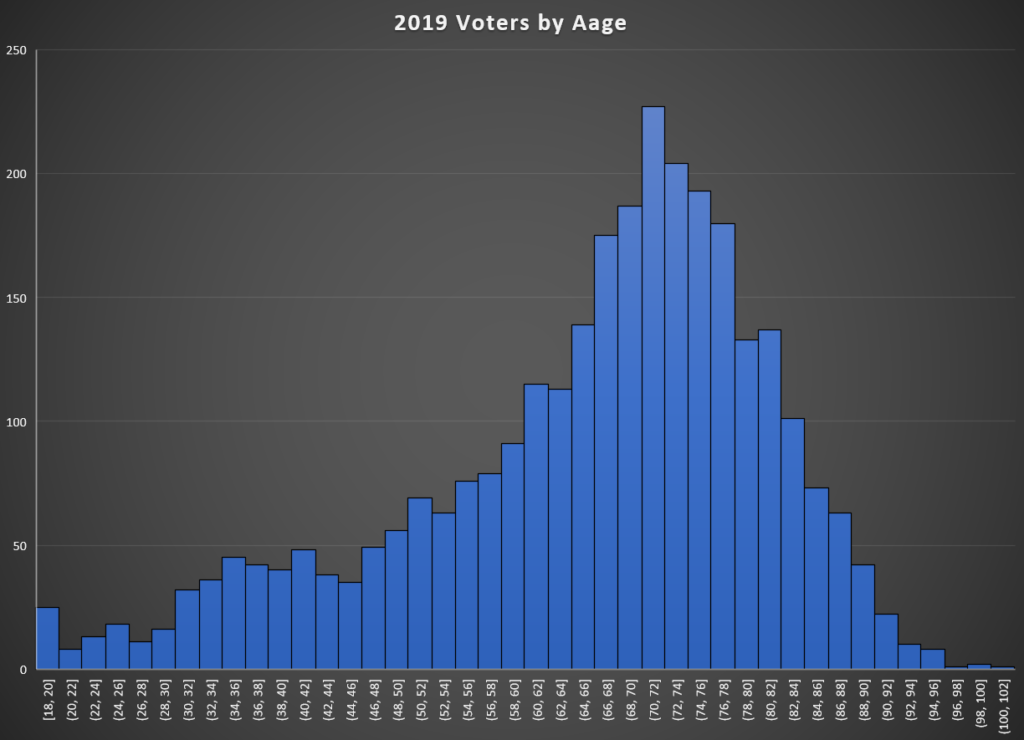
In the graph shown above, we see that the vast majority of voters are between the ages of 65 and 85. In fact, about 57% of voters are within that age bracket.
In the last age graph below, we compare the percentage of these age groups in the general population versus the ages in the voting population. Orange is the general population, and blue is the voting population.
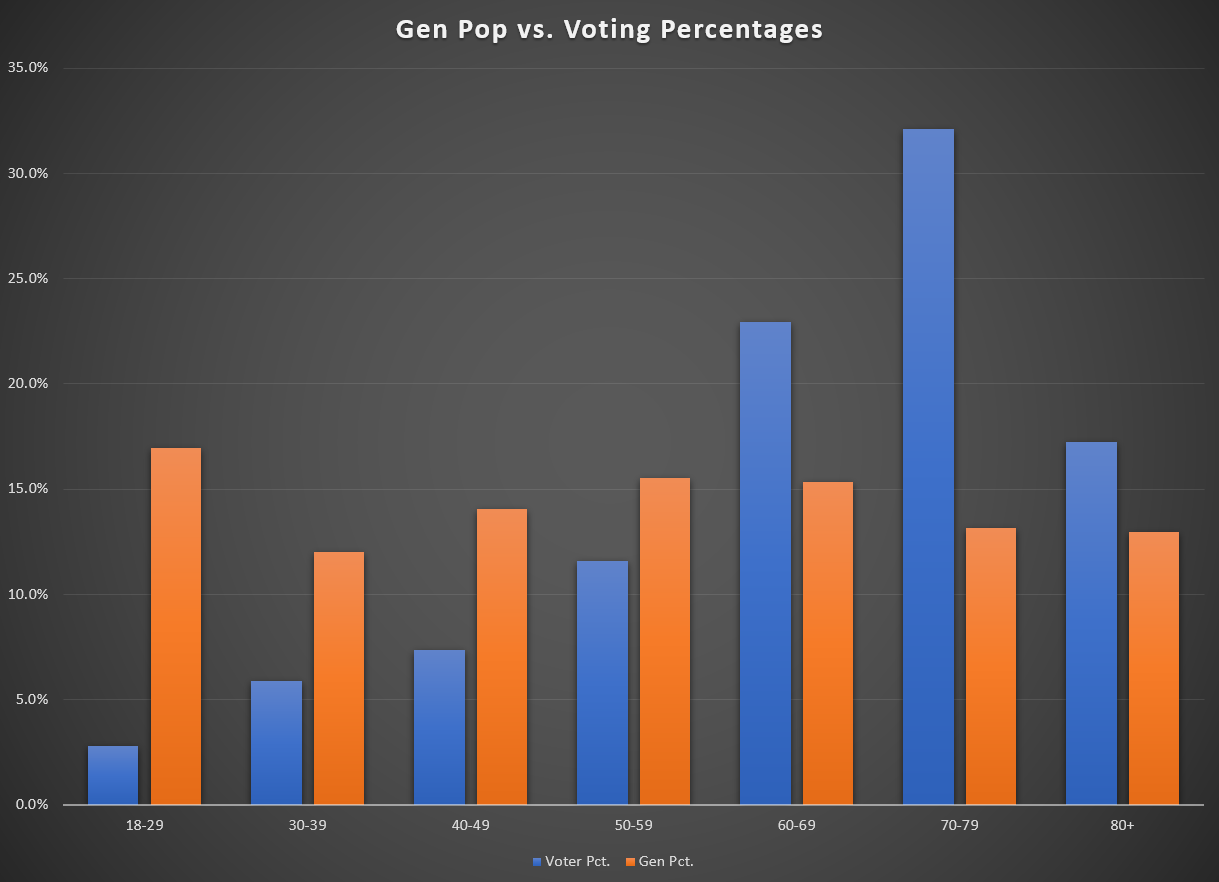
This last chart gives us our main “age” takeaway… Older voters (over 55) are much more likely to vote than younger voters. The group with the highest probability of voting is the 70-79 year olds. The age group least likely to vote is the 18-29 year old group.
- Voter turnout for under 55 voters: 9.4%
- Voter turnout for over 55 voters: 27.6%
First-Time Voters
First, let’s make a distinction. For our purposes, we’re defining “first-time voter” as someone who did not cast a ballot in the 2017 nor the 2018 citywide election, but they did cast a vote in the 2019 election. For this May’s election, there were 578 voters that met that criteria. 578 voters did not vote in 2017 or 2018, but cast a ballot in 2019.
These “new” voters made up 19% of the total number of ballots cast in 2019.
This group of voters is somewhat younger than the average voter, but their geography is widely distributed. In other words, they are younger overall, but they do not reside in one specific area of town.
Takeaways
- Local elections are dominated by the older age groups.
- Younger voters register in high numbers, but don’t actually vote very often.
- The older the voter, the more likely she is to cast a ballot, until reaching age 80, when the likelihood begins to decrease.
- This election energized 578 voters that had not cast a ballot in a few years. This group made up nearly 1/5 of the ballots cast.
- If all voices are to be heard in local elections, voter turnout efforts must continue.
Sources
- Population and demographics from US Census Factfinder for Kerrville city, Texas.
- Voter demographics and analysis compiled from reports provided by the Kerr County Elections department.
Written by Aaron Yates, founder of Kerrville United


